
You can easily find out which marketing channels bring in clients that spend the most over the lifespan of your connection with your business and which products should be placed top of mind with Ecommerce Insights.
Customers may get statistics on product performance, cohort performance, and repeat purchase rates with just a few clicks, even without data mining, report development, Excel, or cloud-based reporting solutions.
Ecommerce Insights is an optional add-on that business owners can purchase in addition to the subscription reports. To purchase Ecommerce Insights, go to Analytics › Insights and follow the steps that appear on the page. To uninstall Ecommerce Insights, please contact our support team.
Understanding ecommerce Insights
What we call an “ecommerce insight” is really just a data-driven conclusion that can lead to changes to your website, business, items, or marketing channels. If your sales data shows that product pages with reviews have a 34% greater conversion rate than pages without reviews, you can conclude that social proof increases conversions.
On a broader scale, these results may become industry trends, illuminating the transformations, disruptions, growth, and challenges faced by e-commerce businesses.
Why ecommerce Insights Matter
Transforming data into actionable ecommerce insights can be achieved by asking focused questions that you believe will contribute to your company’s future growth. If predictions for the industry show that social commerce will grow, you might want to consider whether you’ve seen an uptick in your social media channels’ reach, conversion rates, or sales. In that situation, you should be visible on the sites where your target audience shops. For insight on choosing the best online platform to reach customers, check out our guide on top ecommerce platforms.
You can learn the outcome of a decision you took to improve your company’s performance with the help of ecommerce insights.
Picture this: you completely updated your website and added pop-ups that allowed visitors to access your live shopping experiences. Was there an increase in opt-ins when you sent more clients there? Did live shopping session participants typically have a lower return rate than average? It was the right decision to act on those ideas if you said “yes” to both questions.
7 Key Ecommerce Trends
New Social Platforms
People engage in what is referred to as “social commerce” when they make purchases using social media platforms. The idea is not new, but the ways in which people are making purchases are changing.
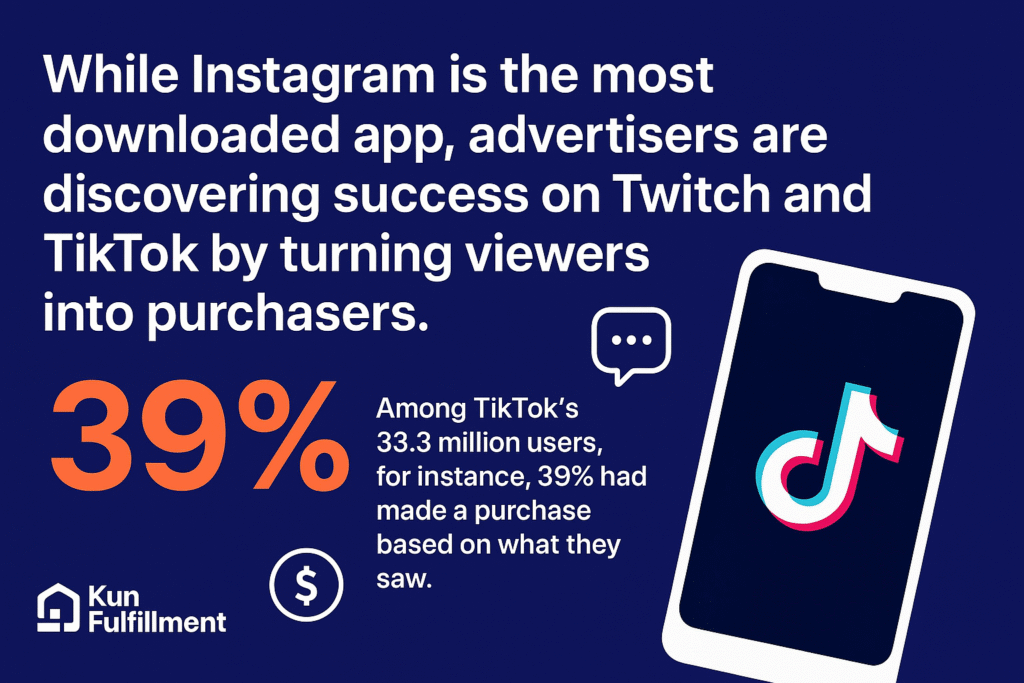
While Instagram is the most downloaded app, advertisers are discovering success on Twitch and TikTok by turning viewers into purchasers. Among TikTok’s 33.3 million users, for instance, 39% had made a purchase based on what they saw.
When considering the role of social media in driving website traffic, brands should not be held solely responsible. Users with a lesser following who are great at filming short movies are being sought after by brands in the e-commerce business for their user-generated content (UGC). This material gains more credibility when it seems to have originated from a recognized person rather than a faceless corporation.
To check if this is relevant for your store, you can examine the session count, customer acquisition cost (CAC), and customer lifetime value (CLV) divided by traffic source. To better understand customer lifetime value and optimizing acquisition, take a look at How E‑Commerce Retailers Can Impact Consumer Behavior. Leaders should be your primary target if you wish to generate revenue through social commerce.
AI Drives Buying Choices
Artificial intelligence (AI) has been the most common term of the year. It would appear that machine learning is invading every aspect of our lives, and the concept is “equally concerned and excited” for 45% of American adults.
Online buying is becoming increasingly personalized in many ways. The majority of online shoppers (73%) want a tailored shopping experience and will go elsewhere if they don’t get it. On a grand scale, this personalized experience might be realized with AI. It is able to make product recommendations to customers based on their previous purchases.
You can test this hypothesis for your e-commerce site with retargeted ads. If your customers are active Facebook users, you may utilize the Meta pixel to create a targeted advertising campaign:
- Visited specific URLs on your online store (i.e., product pages)
- Selective link clicking occurred (i.e., I visited your category page but not your product page).
- Still haven’t finished buying anything, despite adding it to their shopping cart.
For the purpose of testing this, create two sets of advertisements for each group. One set will show the user products that they have already viewed based on their behavior in the dynamic campaign. The other set will show products that you believe they might be interested in. Keep the two conversion rates in comparison. The campaign that incorporates AI is expected to get a far higher return on investment (ROI). Learn how fulfillment plays a key role in delivering efficient AI‑driven experiences with our deep dive into 3PL Services.
Inflation Concerns
Searching for the lowest price has long been a human trait. Customers nowadays are looking for bigger deals than those in the past. Amid the highest inflation rate in years, over half of consumers are cutting back on spending on necessities.
This e-commerce intelligence, when combined with your own data, can help you conduct campaigns that are more focused. Reserving your best deals for specific occasions is more prudent than giving them to random customers.
- Products that aren’t generating enough revenue to warrant investing in more inventory
- Customers who have abandoned their carts
- Customers who have shopped with us before but haven’t bought anything in a while
If you wish to attract clients who are cutting expenditures due to inflation issues but discounts are not an option, consider offering gift cards or bundling your best-selling products. Using one of these methods can boost your average order value (AOV) while decreasing the effect on your profit margins.
Buy Now, Pay Later
The “buy now, pay later” (BNPL) option is becoming more popular among consumers. Generation Z is planning to use BNPL services at a rate of 47% by 2025, compared to 25% of consumers who have used them.
This is especially important during the Black Friday and Cyber Monday (BFCM) weekend and other peak sales periods. To be ready, familiarize yourself with the most popular online payment option from the previous year. Problems with BNPL were big worries for most businesses. Over the course of the 2024 BFCM weekend, consumers spent an estimated $8.3 billion.
You should consider accepting BNPL if you see that your clients are going along with the current trend. Shop Pay Installments allows customers to buy now and pay for it in four equal installments. Kun Fulfillment is in charge of collecting payments from sellers, who are still paid in full upfront, even when customers pay in installments.
Flexible Fulfillment
Shoppers are slowly making a return to brick-and-mortar stores after feeling forced to shop online. With an expected $7.9 trillion in in-store sales by 2026, key performance indicators (KPIs) such cart abandonment rate could be impacted.
Take a look at the industry average for cart abandonment percentages and compare them to your device-specific numbers. You can reach out to customers within a ten-mile radius of your stores if you see a rise in mobile cart abandonment. Check out your POS system’s dashboard. Is there any proof that buyers who abandoned their carts actually went ahead and bought anything?
This is a perfect example of how one data piece is insufficient to construct a robust ecommerce insight. You might not be losing clients completely if you solely consider the cart abandonment percentage; perhaps they are just opting to buy in-store instead. Explore how modern fulfillment setups streamline omnichannel operations in our post about 3PL Warehouse.
Rise of Eco-Consumerism
About a third of buyers would want to buy from companies that do something positive for the environment. Moreover, 60% are prepared to shell out extra cash for eco-friendly packaging.
You can find out if your company practices sustainability by A/B testing the effects of terms like “sustainability,” “eco-friendly,” and “environmentally friendly” on your product pages. Remember that uttering these words is not enough. Since over half of fashion consumers don’t trust brand claims, it’s important to show that you’re trying to lessen your environmental effect by delivering on your sustainability pledges.
Monitoring the performance of apps like Planet is another possibility. Carbon neutral shipping is made possible with this Kun Fulfillment tool by contributing a portion of the proceeds to environmental conservation groups with every purchase. Without changing a thing about your store, you can see an increase in conversion rates and a decrease in cart abandonment rates, both of which lend credence to the premise that customers desire to back environmentally responsible products.
Sustainability efforts often tie into intelligent packaging and fulfilment choices; see more in our article on Fulfilment Services.
Growth of Live Commerce
The term “live commerce” describes a specific type of internet trading that occurs in real time. Following the $2 billion made by Chinese influencer Li Jiaqi in a single livestream—a testament to the channel’s ability to attract audiences and convert them into buyers—brands are redirecting their marketing efforts towards live streaming.
Fashion house Luxe Collective has created a state-of-the-art e-commerce platform that takes live buying to a whole new level. Shoes, jewelry, and handbags from high-end designers are sold on its website, which is notorious for its high return rates. With 360-degree product views and real-time product information from salespeople, online shoppers find it easier to complete a transaction. For deeper logistics insights supporting live selling and seamless delivery, check our Comprehensive Guide to Fulfilment Centres.
Ecommerce Insights Guide
Are you interested in learning more about how these insights from the e-commerce business might benefit your company? If you follow these procedures, you will be able to get the most out of the data on your store.
Craft a Hypothesis
There are many aspects of your business that you are interested in knowing more about, including your website, marketing, customers, and actual products. And maybe most importantly, what are your intentions for responding to the response that you have been given?
“There is no such thing as a single source of truth for all of your answers,” says Daniel Patricio, the operator of the online food business Bull & Cleaver. “There is no such thing as” The answers to a wide range of issues can be found by considering your analytics from a number of individual angles. Consequently, the question that should be posed first and foremost is, “What is it that you are actually attempting to answer?”
In the event that you begin to investigate the statistics of your online store, you will discover that rabbit holes arise spontaneously. This is due to the fact that a single question that is well-crafted can result in a response, which can then result in other questions, which can then result in even more answers. On the other hand, if you do not have a question to serve as a starting point, you will be compelled to spend time wading through your data analysis without any direction, which will result in a waste of time.
Here are a few examples of suitable questions:
- Over time, have you seen any shifts in the behavior of our landing page traffic?
- How many individuals check it out but end up not making a purchase?
- Where am I seeing the bulk of my consumers exit after checkout?
- How probable is it that they will make a purchase when comparing the likelihood of social media campaign visits to email campaign visits?
- You introduced a pop-up to your site two months ago; did it assist or hurt conversions?
- Could you please let me know how our shop page is being used?
- What do the product pages tell us about our products?
- How much money did last month’s Google Ads campaign make?
Collect Information
Now that you have a solid plan for what you need to know, it’s time to start collecting data from anywhere it can have an impact on your store. This data can teach you a lot about your clientele, website visitors, and wares.
You can now more quickly monitor audience behavior across groups, produce personalized reports, and undertake meaningful data dives with the latest version of Google Analytics, a free and widely used analytics software. The update also improves the process of accessing essential data. Checkout more on order fulfilment process.
It all depends on your setup, though; your pre-configured analytics tool may not be able to unearth finer ecommerce data. It may be essential to review Kun Fulfilment data, make adjustments to your GA dashboard, or use a new analytics solution.
At all costs, you should not make business decisions based on a partial vision.
- Track Ecommerce Stages: Track individual stages (e.g., product views, add to cart) in the purchasing process for products.
- Monitor Micro-Conversions: Track micro-conversions such as newsletter signups.
- Optimize Facebook Ads: Measure ad frequency or cost per page.
- Analyze Product Returns: Identify which products customers return most often.
- Use Heatmaps for Insights: Analyze browsing behavior on product pages to find what grabs user attention.
- Build Smarter Ecommerce: Create a data-driven, optimized ecommerce strategy to improve your ecommerce business.
Track, Analyze, and Improve Ecommerce Performance
Finding out whether your hypothesis was correct is the next step. By combining information from several sources, you may have a clearer view of how well your e-commerce business is doing.
A person suffering from confirmation bias is more likely to look for evidence that backs up their idea and less likely to consider evidence that challenges it. Do not give in to this bias. Aim for impartiality: Evaluate the current situation by looking for evidence that could contradict your theory.
Josh Neuman, the developer of Chummy Tees, asserts that “behind every digital tool and dataset are real people making thoughtful choices.”Despite our reliance on data, a considerable amount of gut instinct is still involved! Understanding the significance of the numbers requires practice.
Actionable Steps from Ecommerce Insights
Optimize Social Media with Buyer Insights
There are a lot of moving parts in your firm, so it’s important to watch how enhancing one area can affect another. Due to marketing data showing that the Bull & Cleaver sample pack was effective in converting first-time purchasers, Daniel Patricio decided to try increasing traffic to the website of the pack.
You may experiment with greater assurance when you can examine the repercussions, costs, and advantages of decisions like traffic redistribution. If analytics reveal any unintended implications, they can serve as a warning mechanism.
Prioritize Offers Using Conversion Rates
When there are a lot of flavors to try, it could be difficult to narrow down your options and make a final decision. As a remedy, Daniel devised a sample box of his best-selling products that first-time buyers could try.
He decided to roll out the idea company-wide after seeing the success of bundles on the shop page.
Even while page traffic was fine, conversions decreased, according to Google Analytics. Consequently, he investigated the movement of interest and clicks from site visitors using a heat map program. His research showed that people were ignoring the bundles as they scrolled down. Buyers requested more information about the products before purchasing a bundle, according to the statistics.
He was able to reduce the size of the sample bundles even further and raise the conversion rate on the shop page by about 20% thanks to this feedback loop.
Restock Smartly with AOV Insights
There are several possible explanations for the sudden and unexpected collapse of an apparently strong metric, as seen by the fall in Bull & Cleaver’s average order value for returning customers. Were changes in marketing strategy, technical difficulties with the website, or just the passing of the seasons to blame for the precipitous decline in demand? They had planned to bring back an important product after diversifying their offerings, but they were unable to do so due to a lack of inventory.
It is simple to generalize about a total performance without taking into account all the important metrics. Therefore, you need to inquire: Could any other metrics be influencing this one too? The primary focus of AOV is the sales of products.
As part of his investigation, Daniel created a simple spreadsheet and discovered that sales of a certain product had collapsed.
See how each product’s overall sales % changed from one month to the next:
| Category | Previous Percentage | New Percentage |
| Bulk | 45.88% | 34.57% |
| Bundle | 32.61% | 44.57% |
| Slab | 9.45% | 0.69% |
| Snack | 12.06% | 20.18% |
Even while the sold-out items brought down several averages, the average order value for returning consumers took the most hit.
Based on this ecommerce insight, which showed that the product was popular, especially among current consumers, he should attempt to expand the category’s appeal. This is why Daniel can’t wait to bring the product back to stores. Simultaneously, he has resumed sales without it and anticipates a rise in revenue and customer retention when it is reintroduced.
Key Questions to Unlock Data Insights
While ecommerce insights could seem overwhelming at first, data literacy is a skill that develops over time. But you can teach yourself to be curious about your business and find the best places to acquire answers by asking and answering questions over and over again.
Unlock Business Success Using Kun Fulfillment’s ecommerce Insights
You can make better decisions faster with Kun Fuilfilment’s user-friendly statistics and reporting. Make better decisions, seize more chances, and see trends with the help of pre-made dashboards and reports or create your own.
Boost Your Business Now
Frequently Asked Questions (FAQs)
In what ways could ecommerce analytics benefit online businesses?
Ecommerce analytics can help business owners track and improve conversion rates, understand cart abandonment rates, and optimize their marketing strategy. For instance, actionable insights from online shopping data, such as identifying popular products or average order values, can drive smarter decisions for ecommerce businesses.
What are the key differences between ecommerce insights and ecommerce analytics?
Ecommerce insights focus on understanding customer behavior and validating marketing strategies, while ecommerce analytics deals with data-driven metrics like conversion rates, cart abandonment rates, and average order values. Insights offer the “why,” whereas analytics provides the “how” in online shopping trends.
What does the future hold for ecommerce businesses and online shopping?
The future of ecommerce in 2024 will be shaped by advancements in social media-driven marketing strategies and shifts in consumer priorities, such as sustainability. Business owners will rely more on ecommerce analytics to enhance customer experiences and grow conversion rates, while creators will influence brands’ success in the online shopping space.
How fast is the ecommerce industry growing?
Online shopping continues to thrive, with the ecommerce industry’s market value reaching $5.8 trillion in 2023. Projections suggest it will exceed $8 trillion by 2027, highlighting massive growth opportunities for ecommerce businesses. Tracking metrics like conversion rates and cart abandonment rates will remain vital for business owners to stay competitive.


